
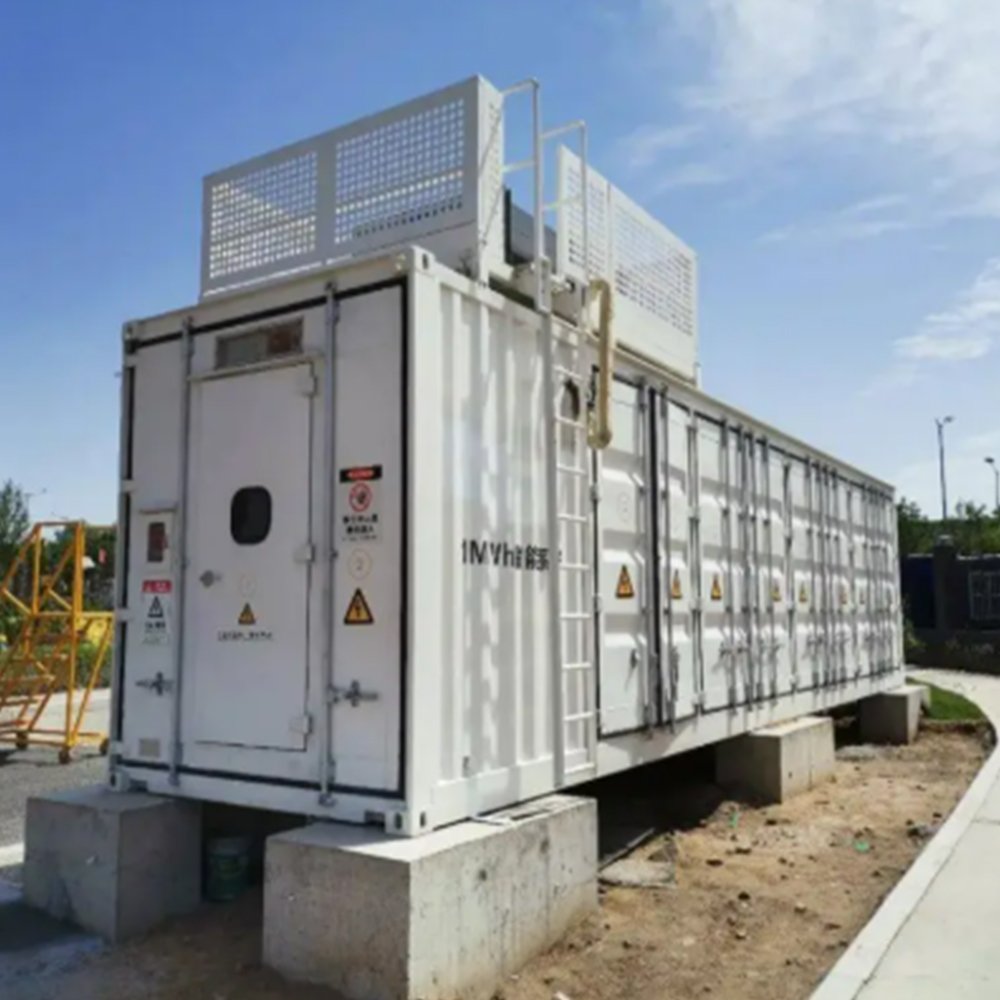
Fast charging can create short, high site peaks. Where a tariff bills monthly demand, a battery may cap grid import during those events. The value depends on the exact billing rule and the operator’s ability to recharge without creating a second peak.
A global battery-cost benchmark cannot replace a local cash-flow model. Charger use, tariff structure, grid upgrade cost and service obligations must be entered separately.
For a concrete equipment-level review, apply the checks above to the 100/200kWh storage-integrated charging solution and request confirmation for the intended site conditions and operating mode.
The general calculation sequence is set out in the peak-shaving battery sizing guide. For charging sites, replace the factory load series with session-level charger demand and retain the same tariff-interval discipline.
Direct answer: Reproduce the utility bill from interval data before modelling storage. If the base model cannot match billed demand, the savings forecast is not ready for investment approval.
Research review date: 4 October 2026. Quantitative statements are tied to the linked source and should be rechecked if procurement occurs later.
The Alternative Fuels Data Center guidance on charging-station operating costs notes that DC fast charging is more likely than lower-power charging to trigger demand charges and describes demand as commonly based on the highest 15-minute average in the billing period. The project model should therefore reproduce the local tariff interval instead of smoothing sessions into hourly data.
Before design freeze, the project team should review DOE utility-rate guidance. Utility bills can combine energy, demand and time-of-use components, so savings models must use the actual tariff rather than a generic peak/off-peak spread.
Reproduce the tariff demand interval
For Commercial charging operators and site owners, the first task is to turn the intended service into measurable inputs and acceptance limits. The following table keeps the decision tied to evidence instead of a broad product label.
| Model layer | Required data | Output |
|---|---|---|
| Charging demand | Sessions, dwell time and power curve | Uncontrolled site load |
| Non-charging load | Building and auxiliary interval load | Total site demand |
| Tariff | Demand interval, ratchet and time periods | Baseline bill |
| Battery dispatch | Power, energy, reserve and recharge rule | Controlled grid load |
| Degradation and service | Cycles, throughput and maintenance | Lifecycle cost |

The same evidence and acceptance questions can be used when assessing HMX’s energy-storage charging solutions; catalogue information should be reconciled with the controlled quotation and drawings.
For the final evidence review, use IEA Global EV Outlook 2026 charging analysis as a source check. IEA estimates more than 7 million public charging points at the end of 2025, after growth of more than 33% in one year; fast and ultra-fast points reached 2.2 million.
Replay charger sessions against the grid cap
The commercial offer should state its assumptions, exclusions and measurement boundary. Buyers can then compare systems on the same basis and keep later design changes under document control.
| Scenario | Question | Sensitivity |
|---|---|---|
| Low utilisation | Are peaks rare but expensive? | Demand savings versus fixed cost |
| Growth case | How fast do sessions increase? | Expansion and grid limit |
| Back-to-back sessions | Can storage recover between peaks? | Recharge power |
| High tariff spread | Can recharge move off-peak? | Energy cost |
| Backup reserve | Must energy remain unused for outages? | Available shaving capacity |
Action points for the project team
- Run at least a base, growth and stress scenario.
- Include months with special events or seasonal fleet peaks.
- Do not count the same battery capacity fully for charging support, demand shaving and backup at the same time.
- Use contractual availability and response requirements in the financial model.
For current market and policy context, review IEA Electricity 2026 flexibility analysis. The IEA identifies batteries as a versatile source of short-term power-system flexibility, but the required duration depends on the service being delivered.
Where demand-charge models overstate savings
These are the practical objections and failure modes most likely to stop approval, delay commissioning or create an avoidable service call for Commercial charging operators and site owners.
- The baseline model cannot reproduce the billed demand.
- A recharge event creates another peak in the same billing period.
- Session growth is included in revenue but not in grid or battery stress.
Questions the buyer should ask before approval
- Which exact interval, ratchet and seasonal rules apply?
- How does a back-to-back fast-charging day change the result?
- What capacity remains unavailable because of backup reserve?
Make the financial model reproduce operations and billing
Validate the tariff engine against actual invoices, including interval length, time periods, ratchets, minimums and seasonal rules. Combine charger sessions with the rest of the site load. The baseline should reproduce both monthly kWh and billed kW within an explained tolerance before storage dispatch is introduced.
A related HMX reference is the commercial and industrial energy storage range. Use it to frame the next supplier discussion, then record project-specific deviations before ordering.
Simulate the battery with power, usable energy, reserve, efficiency, auxiliaries and recharge constraints. Review the state of charge after every high-demand event. Back-to-back sessions can exhaust the buffer, while aggressive recharge can set a new peak. The model should count target breaches rather than assuming every event is shaved successfully.
The technical comparison should also be checked against IRENA Renewable Power Generation Costs in 2024. IRENA reports a 2024 global average installed cost of USD 192/kWh for utility-scale battery storage, 93% below 2010. Buyers should not treat that global benchmark as a project quotation.
Present cash flow as scenarios, not one guaranteed saving. Include utilisation growth, tariff change, degradation, service, downtime and alternative grid work. If backup reserve is required, remove it from the economic dispatch window. The decision should compare the value of faster site deployment and managed grid demand with the full lifecycle obligation.
Project workflow
- Reproduce historic bills from interval load and tariff rules.
- Simulate sessions, recharge and reserve across complete months.
- Run utilisation, tariff, degradation and availability sensitivities.
- Tie investment approval to auditable assumptions and operating KPIs.
Keep the calculation reproducible
Save the raw meter or load file, cleaning log, tariff or operating rules, model version and every assumption that converts site data into power and energy. The owner should be able to rerun the base case when production, tariffs, loads or reserve policy change instead of treating the original result as permanent.
Buyers defining the initial scope can compare these requirements with HMX’s Malaysia factory storage project. The page is a product or project reference; final suitability still requires a written project specification.
- Raw and cleaned time-series data with time zone and interval documented.
- Base, growth and stress scenarios with losses, reserve and degradation inputs.
- Selected control setpoints and the reason rejected alternatives were not chosen.
- A commissioning trace that connects the model to measured site behaviour.
At handover, give the owner the model inputs and an update trigger. A material tariff, load, production, weather or reserve change should lead to a controlled rerun rather than an unsupported promise that the original saving or runtime still applies.
Commercial Test
Approve the investment only when the operating model reproduces the current bill or service constraint and still works under a reasonable stress case.